
Australia’s December 2019 new car sales figures reported a 13.7% decline in new car sales over the previous year, with 916,968 vehicles sold in 2020 compared to the 1,062,867 vehicles in 2019.
Victoria, predictably, thanks to lockdowns and dealer closures, was hit the worst, experiencing massive sales regressions of 25.6% (more than a quarter!). New South Wales, Queensland, and Western Australia also experienced sales slumps of 11.1%, 8.9% and 2.7%, respectively.
The only one to see an increase was the Australian Capital Territory, weirdly. Documented sales figures roared to a year-on-year high of 22.6%!
Why? A freak hailstorm in early 2020 could be one of the primary causes, as thousands of vehicles were damaged by hail and declared total write-offs by insurers.
Reports by the Federal Chamber of Automotive Industries (FCAI) also revealed Australia’s best-selling manufacturer: Toyota (unsurprisingly), having shifted a massive 204,801 vehicles in 2020. The brand has been relishing in new car sales for years on end, with the close of 2020 setting an 18 year-long streak for the company!
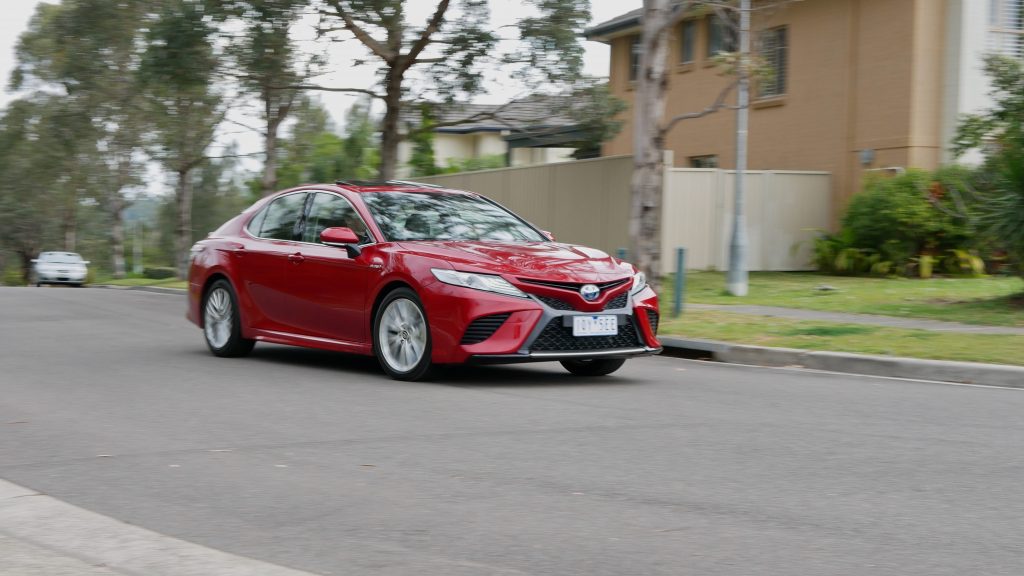
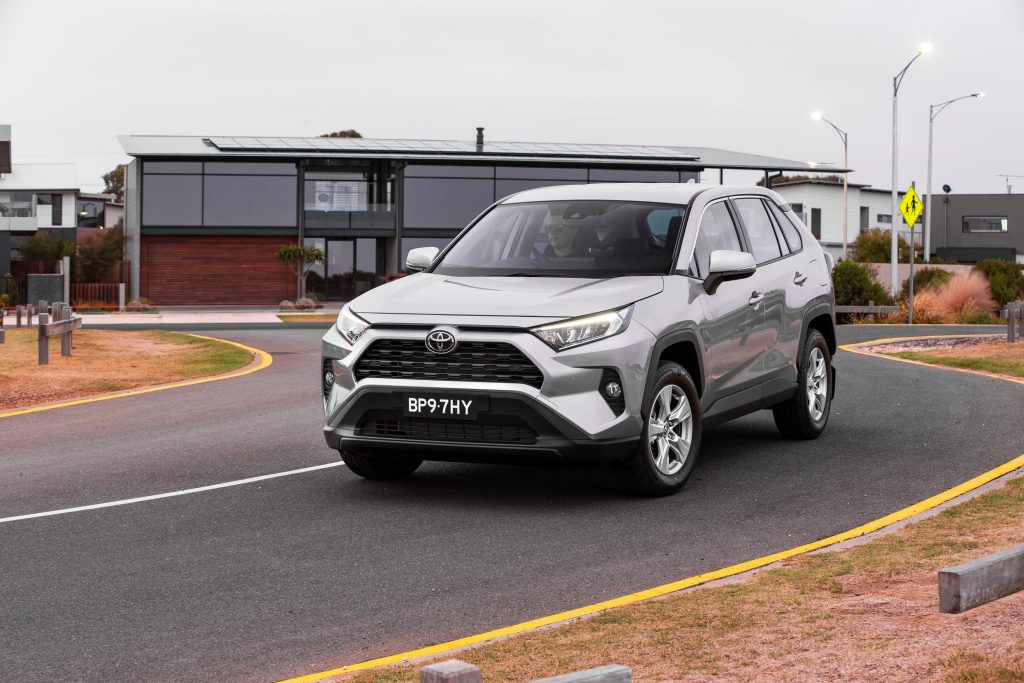
Key factors to Toyota’s new car sales figures include the good ol’ classic Corolla, Camry, RAV4, LandCruiser, and Hilux models (all of which consistently yield strong in-class sales figures), recent 2020 spec/variant alterations to the C-HR, LandCruiser 70-series, RAV4, and Supra; new variant introductions, such as the 2021 Toyota C-HR GR Sport and rampant 200kW/370Nm 2021 Toyota Yaris GR hot hatch; MY2021 facelifts to the HiLux, Hilux Rogue, Hilux Rugged X, and Fortuner; the introduction of the fourth-gen Toyota Yaris; and the launch of a new vehicle altogether: the 2020 Toyota Yaris Cross.
We’ll have a review of the latter coming out soon!
(For those keen on purchasing a new Toyota, remember there’s also the updated 2021 Toyota Camry arriving later this year and the Toyota Corolla Cross after that in 2022.)
Second place went to Mazda, having shifted 85,640 vehicles; Hyundai, with 64,807 sales; Ford, with 59,601 vehicles sold; and Mitsubishi, with 58,335 recorded sales. For more information, please refer to our table down below.
Most Popular Manufacturers in 2020
| Place | Manufacturer | Most Popular Vehicle | Monthly Sales | Total Sales | Total Sales Change over 2019 | 2020 Market Share |
| 1 | Toyota | 23,470 | 205,766 | -0.5 | 22.3% | |
| 2 | Mazda | 8,556 | 97,619 | -12.3% | 9.3% | |
| 3 | Hyundai | 6,734 | 86,104 | -24.7% | 7.1% | |
| 4 | Ford | 6,306 | 63,303 | -5.8% | 6.5% | |
| 5 | Mitsubishi | 6,380 | 83,250 | -29.9% | 6.4% | |
| 6 | Kia | 4,700 | 61,503 | -8.8% | 6.1% | |
| 7 | Volkswagen | 3,291 | 49,928 | -21.4% | 4.3% | |
| 8 | Nissan | 4,216 | 50,575 | -24.2% | 4.2% | |
| 9 | Subaru | 3,402 | 40,007 | -21.3% | 3.4% | |
| 10 | Mercedes-Benz | 3,150 | 31,985 | -7.9% | 3.2% |
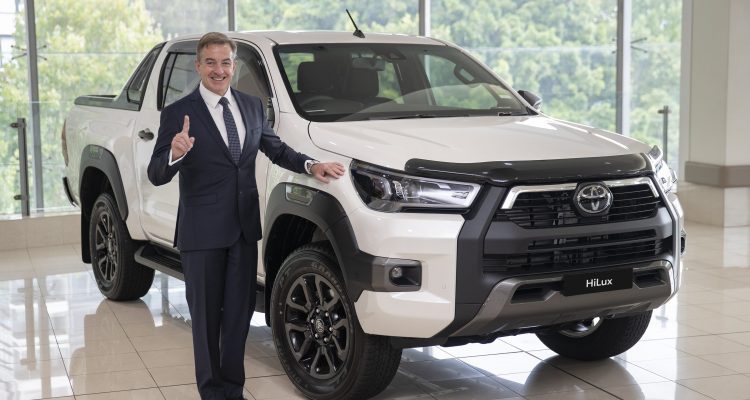
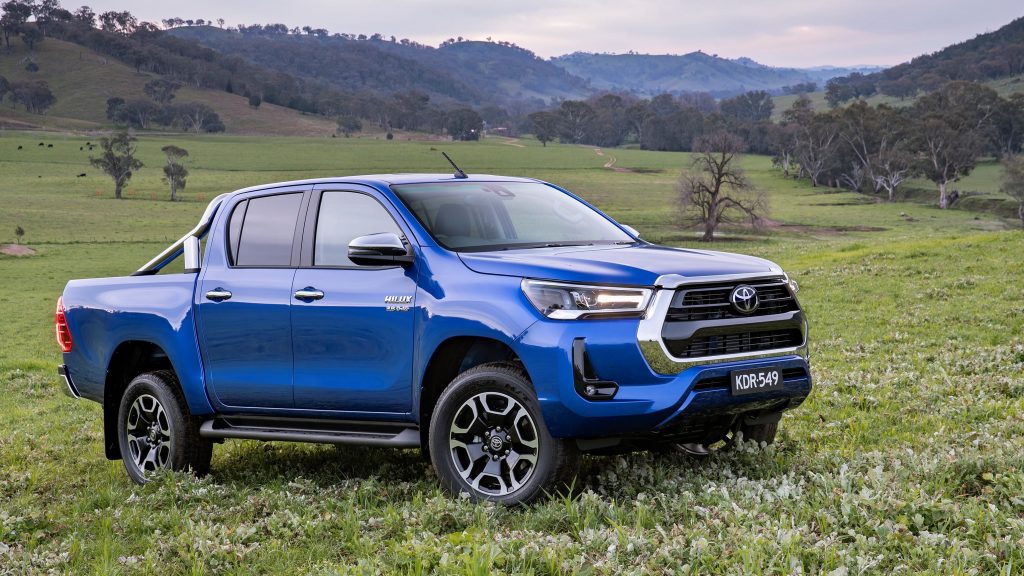
Complementing Toyota’s record as the most popular vehicle manufacturer in Australia was the Toyota Hilux, which, for the fifth year in a row, was Australia’s most popular model.
After experiencing a sales decline of around 20% in June, Toyota launched the facelifted 2021 Hilux launched in August, granting it various changes to the interior, exterior, trim & specification, and mild power boosts (20kW/50Nm) to its 2.8-litre turbo-diesel four-cylinder engine when paired with the six-speed auto.
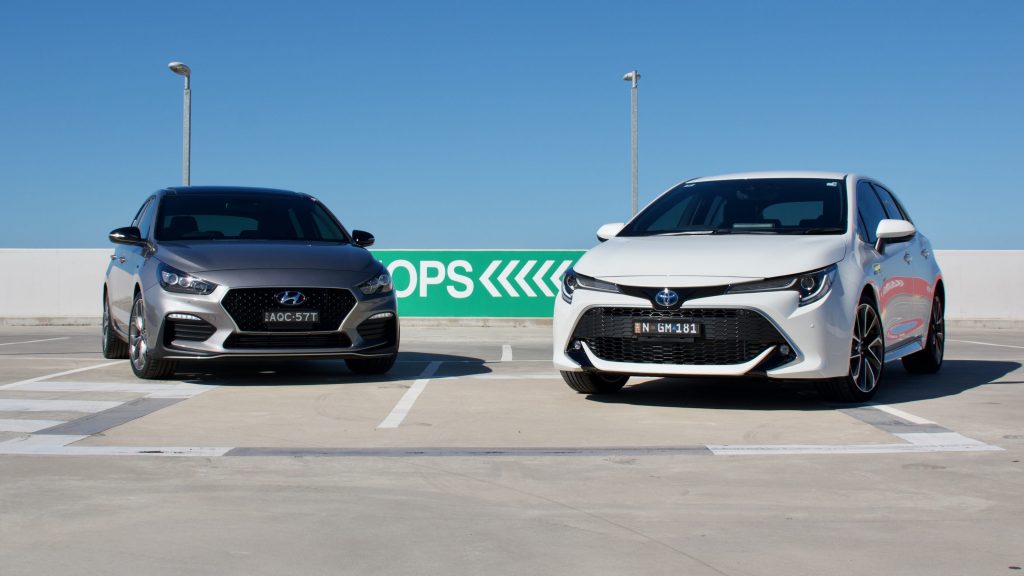
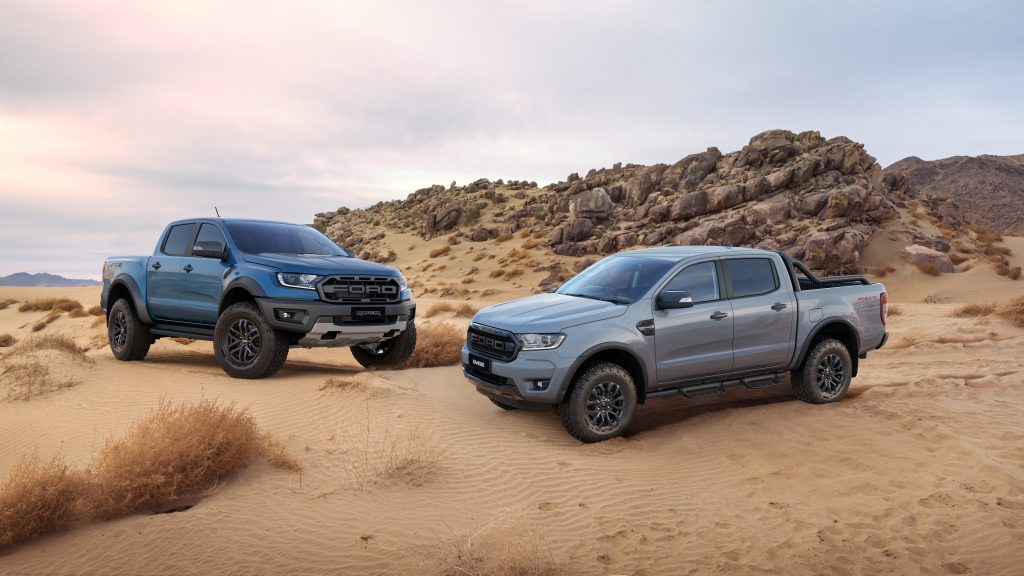
Australia’s second most-popular model was the Ford Ranger, with 40,973 sales; the Toyota RAV4 with 38,537 sales, the Toyota Corolla with 25,882 sales, and the Toyota Landcruiser with 25,142 sales. Big win for Toyota.
The FCAI also reported that of 2020’s ten most popular models, seven are either SUVs or light commercial vehicles. We’ve created a table below that highlights more info on the top 10 models – check it out.
Most Popular Models in 2020
| Place | Model | Dec 2020 Sales | Total Sales | Total Sales Change Over 2019 | Vehicle Segment Share |
| 1 | Toyota HiLux | 5,571 | 45,176 | -6.2% | 25.2% |
| 2 | Ford Ranger | 4,265 | 40,973 | -9.8% | 22.8% |
| 3 | Toyota Rav4 | 3,542 | 38,537 | 58.8% | 25.2% |
| 4 | Toyota Corolla | 2,516 | 25,882 | -15.1% | 24.2% |
| 5 | Toyota LandCruiser | 3,562 | 25,142 | 9.15% | 14.7% |
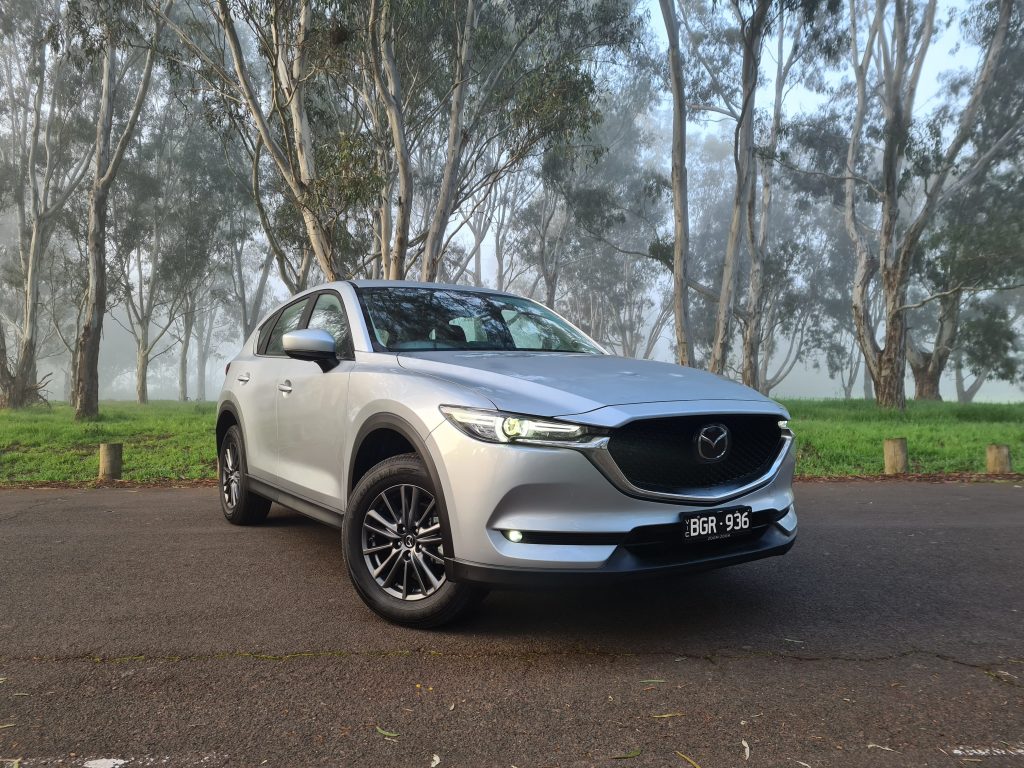
| 6 | Mazda CX-5 | 2,060 | 21,979 | -13.9% | 6.3% |
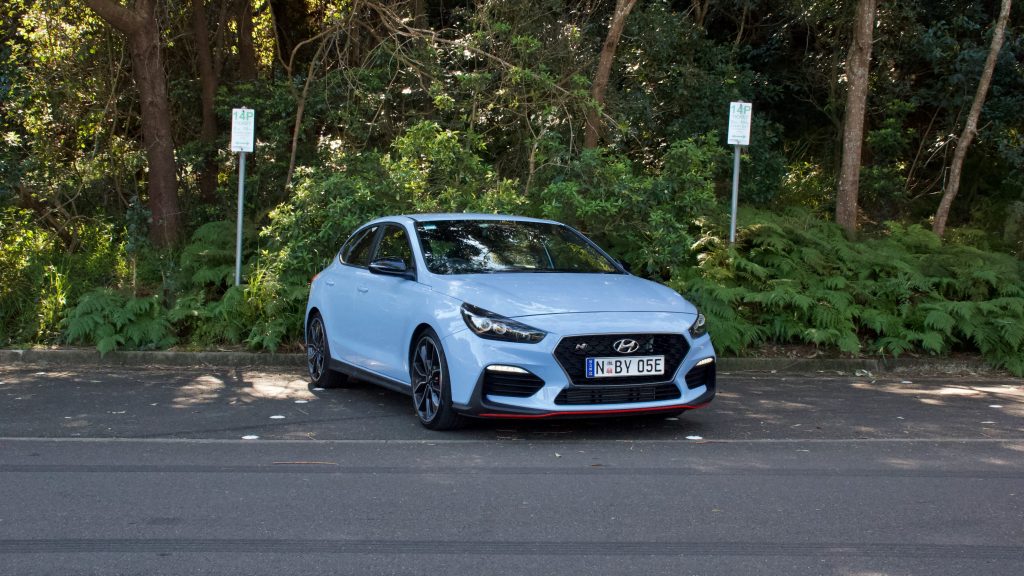
| 7 | Hyundai i30 | 1,996 | 20,734 | -26.9% | 19.4% |
| 8 | Mitsubishi Triton | 1,575 | 18,136 | -25.9% | 10.11% |
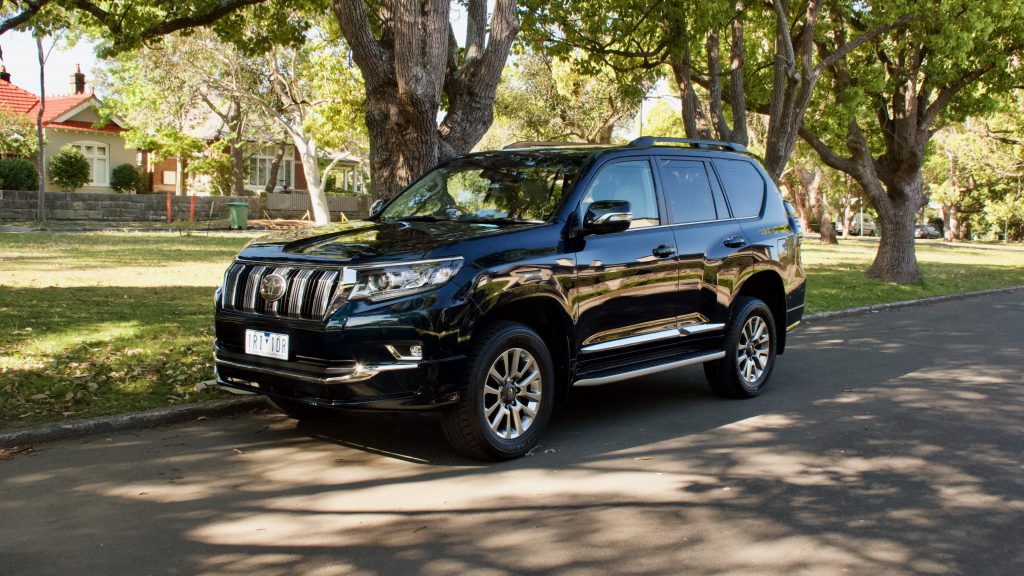
| 9 | Toyota Prado | 2,500 | 18,034 | -1.6% | 19.8% |
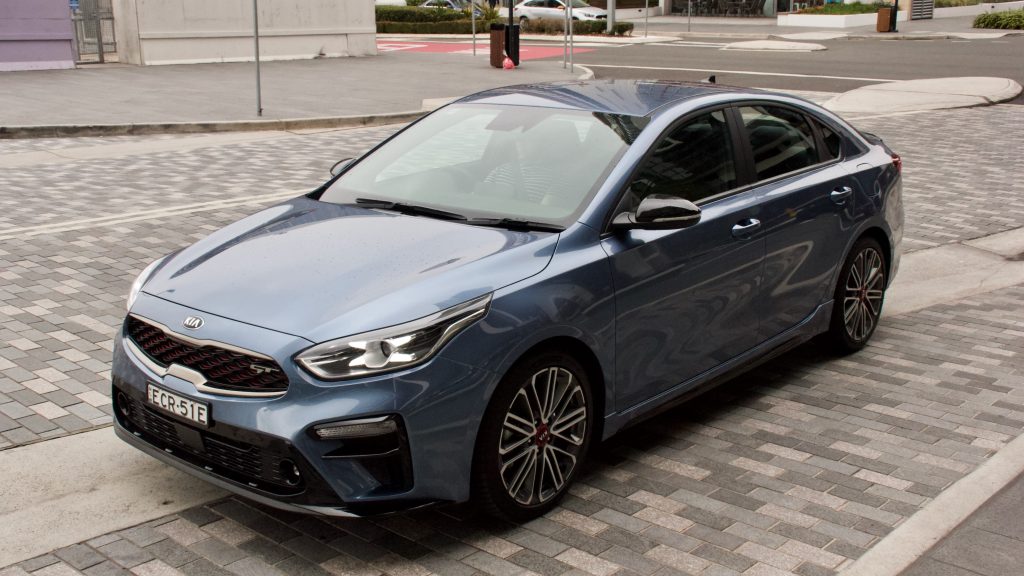
| 10 | Kia Cerato | 1,313 | 17,559 | -19.3% | 16.4% |
SUVs outsold passenger vehicles almost 2:1 in 2020, with 454,701 SUVs sold compared to just the 222,103 units recorded by the passenger vehicle class. Light commercial vehicles – that’s 4×4 and 4×2 utes, vans, and light buses – recorded a total figure of 205,597.
Segment percentages at the end of 2020 sat at 49.6% for SUVs, 24.2% for passenger vehicles, 22.4% for light commercial vehicles, and 3.8% for heavy commercial vehicles.
Medium SUVs were the most popular bodystyle of all, totalling 179,722 sales in all of 2020, followed by the dual-cab 4×4 class, with 152,752 sales; small car class, with 121,118 sales; small SUV class, with 115,761 sales; and the large SUV class, with 108,814 sales.
FCAI chief executive, Tony Weber, commented on the sales figures of the year, saying “COVID-19 has brought a health crisis and a corresponding economic crisis to the world during 2020,”
“And along with the rest of Australia, automotive brands and their dealer networks have found the last twelve months an extremely challenging period.
“The automotive industry in Australia accounts for more than 60,000 employees, with over 4,000 dealerships across the country. The contribution made by these businesses is critically important to the economic wellbeing of communities across Australia. “It is therefore with great relief that the industry, along with the general economy, is finally noting some positive signs within the market.”
Leave a Reply